The purpose of this lab was to follow up with the sandbox activity done earlier in the semester. A digital surface was to be created of the sandbox terrain pictured and measured in the first part of the activity.
In the previous section, the sandbox terrain contained in roughly a square meter was shaped then measured on a grid of points from a "sea level", or a flat surface height from which all points were measured from above. Because the points were all measured below the sea level, each point has a negative value. The points with x, y, and z coordinates were recorded and put into an excel spreadsheet, mocking location in the sandbox. The actual terrain of the sandbox is shown in Figure 1.
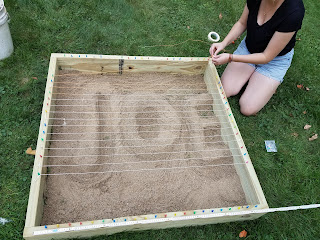 |
| Figure 1: This picture shows the sandbox with the shape of the terrain and the sea level being set above the surface. |
Key Term:
Data Normalization: the process of organizing rows and columns of a database in a way that supports how that data will be used/displayed.
-In the case of this activity, the data had to be normalized from the previous formatting into a way that could be brought into ArcMap and easily understood and mapped.
Interpolation: a tool can be used to predict values in between points or cells in a raster. It is used for continuous surfaces containing values for things like elevation, rainfall, temperature, etc.
-Five interpolation methods were used in this activity.
- IDW
- Kriging
- Natural Neighbor
- Spline
- TIN
Methods
The first step was to create a personal folder for this project within the class folder, as well as a geodatabase for all the results produced throughout the project. Figure 2 shows the geodatabase in ArcMap.
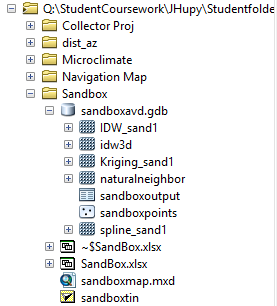 |
| Figure 2: A screenshot of the geodatabase created for this project. |
Next the data in the original excel file had to be normalized from the mock map of the terrain into three columns: x, y, and z. This was done so that ArcMap could easily recognize how the sheet and map it accordingly.
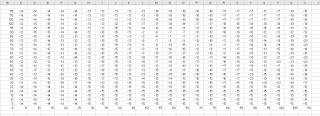 |
| Figure 3: This screenshot shows how the data was originally organized in Excel. |
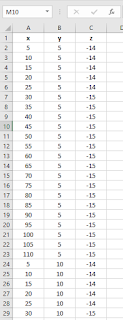 |
| Figure 4: This screenshot shows the data after being normalized for this project into x, y, and z values. |
"Add XY Data" was used to bring points into ArcMap. Once this was done it was converted into a point feature class. When this was done a coordinate system was asked to be assigned, but this was not necessary because the survey was of such a small area and of such accuracy that it was not significant enough for a coordinate system to be important.
Next a continuous surface was created for each of the five interpolation methods. The explanations, pros and cons of each of these techniques is listed below. (information from ArcGIS.com)
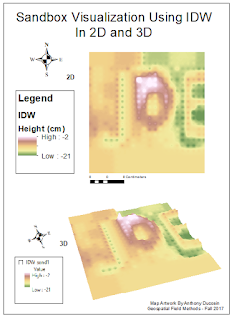
IDW (Inverse Distance Weight) - determines cell values using a linearly weighted combination of a set of sample points. The weight is a function of inverse distance. The surface being interpolated should be that of a locationally dependent variable.
pros: -when samples are densely located the surface will be very accurate
cons: -it can not show the highest peaks or lowest valleys if those values are not already sampled.
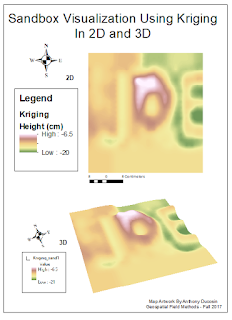
Kriging - a geostatistical model based on autocorrelation, the statistical relationships among the measured points.
pros: -has the ability to estimate the level of certainty or accuracy of the predicted surface.
cons: -extensive and often not necessary if there is no spatially correlated distance or directional bias in the data.
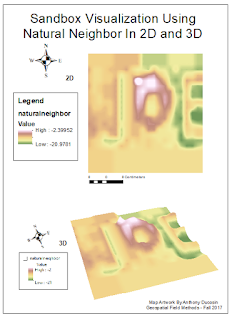
Natural Neighbor - finds the closest subset of input samples to a query point and applies weights to them based on proportionate areas to interpolate a value (Sibson 1981).
pros: -simplest method and creates smooth surface.
cons: -only uses the closest points to estimate surface. It does not infer peaks, low points, or trends.
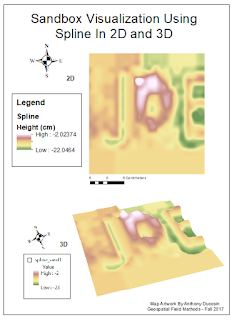
Spline - estimates values using a mathematical function that minimizes overall surface curvature.
pros: -results in a smooth surface that passes exactly through the input points and good for gently sloping surfaces.
cons: -does not accurately represent surfaces that are naturally sharp, steep, or have a lot of variance in close proximity.
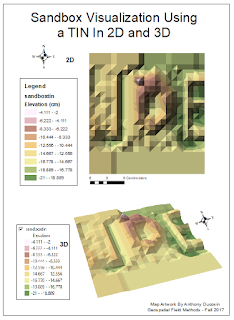
TIN - TINs are a form of vector-based digital geographic data and are constructed by triangulating a set of vertices (points). The input features used to create a TIN remain in the same position as the nodes or edges in the TIN.
pros: -allows preservation of data points while modeling the values between points. This model also takes very little storage space.
cons: -not a smooth surface, very sharp jagged.
Each tool was searched using the search bar and the spatial analyst of each tool was chosen to run the method, as shown in Figure 5.
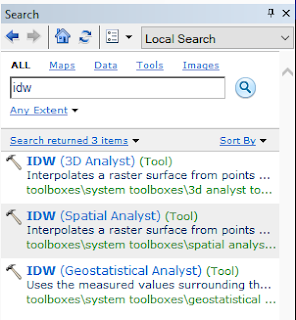 |
| Figure 5: The Search bar was used to find each of the interpolation tools, and the spatial analyst tool was chosen to run each process. |
Each of the surfaces created from the five methods were then brought into ArcScene to be displayed in 3D. They were then exported back into ArcMap to be displayed next to the 2D surfaces. Maps were created to show both the 2D and 3D surface models of the sandbox terrain.
Results
Conclusion
This activity served as just a smaller version of a real survey done on a larger scale of real world surfaces/features. There was a grid of recorded points with x, y, and z coordinates that were used to create a 3D model. That model could be used to measure volumes and distances, create paths, or study observable patterns. Grid based models like this however may not always be the answer because differences in various landscapes will demand specific concentrations of recorded points with x, y, and z values.
Interpolation methods can be used for things other than elevation. It is commonly used for creating temperature, wind, and other weather maps. It can be used for basically any sort of location based recorded data that needs gaps filled in between points to make a continuous (and sometimes smooth) estimated surface.
References
-ArcGISOnline.com
-Professor Joseph Hupy
No comments:
Post a Comment