On September 9th, 2017 imagery was gathered using the DJI Phantom 4, a drone platform with 13.3MP RGB sensor with a rolling shutter. The purpose of this activity was to process this data using PIX4D and create usable maps including the elevation data. PIX4D is the current and premier advanced photogrammetry software that uses images to create professional orthomosaics, point clouds, 3D models and more.
Link to the Software Manual:
-The overlap depends on factors like the speed of the UAV/Plane, the GSD, and the pixel resolution of the camera. The example in the manual uses 75% overlap.
o What if the user is flying over sand/snow, or uniform fields?
-Areas that are sandy or snowy that are more uniform in look will need more overlap. The manual recommends at least 85% frontal overlap and at least 70% side overlap.
o What is Rapid Check?
-Rapic Check is an alternative process that is faster but produces lower resolution results in order to check if coverage was obtained.
o Can Pix4D process multiple flights? What does the pilot need to maintain if so?
-Yes, multiple flights can be merged together, but each has to have the same horizontal and vertical coordinate systems. Having enough overlap and similar weather conditions are also important when processing multiple flights.
o Can Pix4D process oblique images? What type of data do you need if so?
-Yes, but the data needs to be tied down with GCPs, and it works better when the terrain is not flat.
o Are GCPs necessary for Pix4D? When are they highly recommended?
-They are not necessary, but they are highly recommended to improve the georeference and accuracy of the reconstruction.
o What is the quality report?
-The quality report documents the details of the results from the processing.
*This activity was used as an example of mapping data that contains errors. Because GCPs were not used to tie down these images during the processing, the elevation is wrong.
The study area is the Litchfield Mine, near Eau Claire, Wisconsin, as shown in Figure 1. This is the same site as the activity earlier in the blog.
 |
| Figure 1: The study area is the Litchfield Mine outside of Eau Claire, Wisconsin. |
Methods
First a new project was created in PIX4D. The project was named based on the date, site, platform type, and altitude.
Then the images were added to the project. It was important to examine the camera properties and fix any incorrect information, because some of the settings were not correct. Figure 2 shows the processing options that can be altered even after they are originally set, but before the processing has begun.
 |
| Figure 2: This image shows the Processing Options window where settings can be altered. |
The rest of the defaults were left as they were, and the initial processing was started. Figure 3 shows the processes available.
 |
| Figure 3: The processes available to be run. They can be checked and then started either one by one, or all at once. |
 |
| Figure 4: The quality report that was produced from the processing. |
 |
| Figure 5: These are some of the details shown and explained in the quality report. |
 |
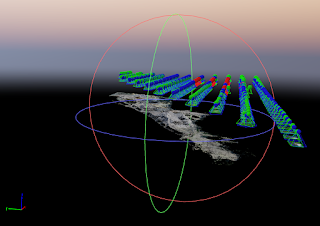
| Figure 6: The reconstructed surface being viewed in the Ray Cloud viewer. The objects floating above the surface are the camera images, which can be turned off. |
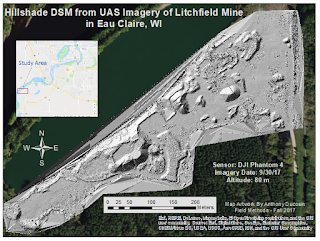
Now that the data had been processed in PIX4D it was time to be brought into ArcMap to create some maps that can help display some of the elevation data. The DSM and Orthomosaic image were brought into ArcMap. A hillshade was given to the second DSM map to better represent the elevation differences in the terrain. The data was assigned the WGS84 coordinate system, and some maps were given a basemap to give them some context.
Results
 |
| Figure 8: This map shows the same DSM map, only with a hillshade added. It really shows the terrain better in regards to slope and texture of the surface. |
Conclusion
Overall this was a good introduction to the current premier photogrammetry processing software for UAS data. It showed that remote sensing can be quite valuable for acquiring highly detailed imagery and producing a 2D or 3D model from the data. When working with this data in the next project and actually using GCPs it will be enlightening to see how these models are not actually as accurate as one might think by just glancing at it.


No comments:
Post a Comment