The purpose of this activity was to illustrate the importance of ground control points (GCPs) in processing UAS imagery and creating accurate digital models of the Earth's surface. The data used for this project was the same as the previous activity, only GCPs were used in the data processing to create a result that is accurate and represents the true elevation of the area surveyed.
GCPs are points on the ground used to "tie down" an image to the representation of Earth's surface, either based on a geoid or an ellipsoid. They are used to georeference images so that the locations on the images can be accurately located on the digital representative surface. Sixteen GCPs were used when surveying the Litchfield mine. They were spread out throughout the area of the mine so that when the resulting data would be processed distortion could be minimized. Because the processing done in the last activity was done using no GCPs, the elevation was based on a ellipsoid, which is the default for DJI and other surveying platforms. The GCPs allow the elevation data to be processed using a geoid, based on sea level, which is the desired result.
The study area is the same as the previous lab, the Litchfield Mine near Eau Claire, Wisconsin.
Methods
Basically the same process was used in this lab as the previous one, the only difference being the use of GCPs in the data processing.
The first step was to save the project after initial processing from the previous lab with a new name in a new folder. Then the GCP manager was opened in the project tab, as shown in Figure 1.
 |
| Figure 1: The GCP manager is shown where the GCPs were to be imported. |
 |
| Figure 2: The GCPs are clicked to their location by zooming into the cross of each GCP in the images. |
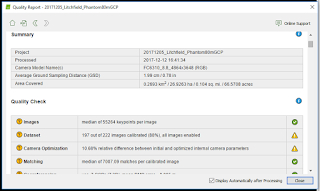
It was then reoptimized again. Then the processing was run for 2. Point Cloud and Mesh and 3. DSM and Orthomosaic. Figures 4 and 5 show the quality reports for these processes.
 |
| Figure 4: The quality report from part 2. in processing. |
 |
| Figure 5: The quality report from part 3. in processing. |
 |
| Figure 6: Arcviewer displays the surface model in 3D with the location of each GCP throughout the mine. |
Now that the processing was completed, the DSM and mosaic images were brought into ArcMap to create maps of the outputs.
Results
Conclusion
The results of the processing with GCPs doesn't look too much different than the results from the previous lab, however when looking at the legend of each map one can observe the difference by over one hundred meters is very important. Using GCPs helps to acquire not only the correct height above sea level for the entire orthomosaic image, but it also helps to create a more accurate model that shows the terrain and change in elevation throughout the mine.


No comments:
Post a Comment